Review


placenta  (PromoCell)


Bioz Verified Symbol PromoCell is a verified supplier
Bioz Manufacturer Symbol PromoCell manufactures this product  
  • Logo
  • About
  • News
  • Press Release
  • Team
  • Advisors
  • Partners
  • Contact
  • Bioz Stars
  • Bioz vStars
  • 95

    Structured Review

    PromoCell placenta
    Placenta, supplied by PromoCell, used in various techniques. Bioz Stars score: 95/100, based on 112 PubMed citations. ZERO BIAS - scores, article reviews, protocol conditions and more
    https://www.bioz.com/result/placenta/product/PromoCell
    Average 95 stars, based on 112 article reviews
    placenta - by Bioz Stars, 2026-03
    95/100 stars

    Images


    Similar Products

    95
    PromoCell placenta
    Placenta, supplied by PromoCell, used in various techniques. Bioz Stars score: 95/100, based on 1 PubMed citations. ZERO BIAS - scores, article reviews, protocol conditions and more
    https://www.bioz.com/result/placenta/product/PromoCell
    Average 95 stars, based on 1 article reviews
    placenta - by Bioz Stars, 2026-03
    95/100 stars
      Buy from Supplier

    95
    PromoCell placenta hpc pl cells
    Placenta Hpc Pl Cells, supplied by PromoCell, used in various techniques. Bioz Stars score: 95/100, based on 1 PubMed citations. ZERO BIAS - scores, article reviews, protocol conditions and more
    https://www.bioz.com/result/placenta hpc pl cells/product/PromoCell
    Average 95 stars, based on 1 article reviews
    placenta hpc pl cells - by Bioz Stars, 2026-03
    95/100 stars
      Buy from Supplier

    95
    PromoCell primary human placenta derived pericytes hpc pl
    Primary Human Placenta Derived Pericytes Hpc Pl, supplied by PromoCell, used in various techniques. Bioz Stars score: 95/100, based on 1 PubMed citations. ZERO BIAS - scores, article reviews, protocol conditions and more
    https://www.bioz.com/result/primary human placenta derived pericytes hpc pl/product/PromoCell
    Average 95 stars, based on 1 article reviews
    primary human placenta derived pericytes hpc pl - by Bioz Stars, 2026-03
    95/100 stars
      Buy from Supplier

    95
    PromoCell placenta hpc pl
    Placenta Hpc Pl, supplied by PromoCell, used in various techniques. Bioz Stars score: 95/100, based on 1 PubMed citations. ZERO BIAS - scores, article reviews, protocol conditions and more
    https://www.bioz.com/result/placenta hpc pl/product/PromoCell
    Average 95 stars, based on 1 article reviews
    placenta hpc pl - by Bioz Stars, 2026-03
    95/100 stars
      Buy from Supplier

    95
    PromoCell human placenta pericytes
    STAT3 expression is reduced in HFpEF <t>pericytes.</t> (A, B) Immunofluorescence staining of control (Ctrl) and HFpEF patient biopsy. (A) Measurement of capillary perimeter. (B) Quantification of pericyte coverage normalised to the vasculature. N = 4 for control and N = 7 for HFpEF. Every data point represents one independent patient. Data are shown as mean ± SEM. P values were calculated using unpaired, two‐tailed Student's t ‐test. (C) Immunofluorescence staining of control and HFpEF mice. Quantification of pericyte coverage normalised to the vasculature. Pericytes were labelled with NG2. N = 4 for control and N = 4 for HFpEF. Every data point represents one independent mouse. Data are shown as mean ± SEM. P value was calculated using unpaired, two‐tailed Student's t ‐test. (D) Uniform Manifold Approximation and Projection (UMAP) plot showing cell‐type specific clustering of all data points from cardiac single‐nuclei sequencing. we identified 13 individual cell types: Cardiomyocytes (CM), Artery (ArtEC), Vein (VeinEC), Capillary (CapEC) and Lymphatic (LymphEC) Endothelial Cells, B Cells, Macrophages (MP), Adipocytes (Adip), Fibroblasts (FB), Pericytes (PC), Smooth Muscle Cells (SMC), Meothelial cells (Meso), Neuronal cells (NC). (E) Gene Ontology (GO) enrichment analysis of significant differentially expressed genes in HFpEF pericytes. Represented are the top 10 downregulated cellular compartments and biological processes. (F) Scatter plot showing Stat3 normalised gene expression values (unique molecular identifier, UMI) for the pericyte cluster in control and HFpEF pericytes. N = 9 for control and N = 3 for HFpEF. Every data point represents one independent mouse. Data are shown as mean ± SEM. P value was calculated using bimod test. (G) Scatter plot showing Stat3 normalised gene expression values (fragments per kilobase of transcript per million mapped reads, FPKM) in control and HFpEF hearts. N = 24 for control and N = 41 for HFpEF. Every data point represents one independent patient. Data are shown as mean ± SEM. P value was calculated using Mann–Whitney test. (H) Immunofluorescence staining of control and HFpEF mice. STAT3 protein expression is reduced in HFpEF mice. N = 4 for control and N = 4 for HFpEF. Every data point represents one independent mouse. Data are shown as mean ± SEM. P value was calculated using unpaired, two‐tailed Student's t ‐test.
    Human Placenta Pericytes, supplied by PromoCell, used in various techniques. Bioz Stars score: 95/100, based on 1 PubMed citations. ZERO BIAS - scores, article reviews, protocol conditions and more
    https://www.bioz.com/result/human placenta pericytes/product/PromoCell
    Average 95 stars, based on 1 article reviews
    human placenta pericytes - by Bioz Stars, 2026-03
    95/100 stars
      Buy from Supplier

    95
    PromoCell placental pericytes
    Mouse mural cells sub-cluster into five groups, resembling cell types previously described in the brain, with one (aaSMC) detected only day 5 after PSNL or sham surgery (A). Acta2 & Tagln high vascular smooth muscle cells (vSMC), arteriolar SMCs enriched for Slit3 and Ctnna3 (aaSMC), Vtn & Abcc9 & Kcnj8 positive <t>pericytes</t> (PC1&2), Adgrf5 negative (PC3) and Acta2 negative pericytes (PC-NC). Expression of marker genes is plotted in B. No prominent differences were detected between sham and PSNL groups at either timepoints.
    Placental Pericytes, supplied by PromoCell, used in various techniques. Bioz Stars score: 95/100, based on 1 PubMed citations. ZERO BIAS - scores, article reviews, protocol conditions and more
    https://www.bioz.com/result/placental pericytes/product/PromoCell
    Average 95 stars, based on 1 article reviews
    placental pericytes - by Bioz Stars, 2026-03
    95/100 stars
      Buy from Supplier

    95
    PromoCell human pericytes
    Effects of glioblastoma multiforme medium on BBB model made by endothelial cells, astrocytes and <t>pericytes.</t> a . A triculture-based model of the blood-brain barrier (BBB) was performed by seeding human hCMEC/D3 cells in the Transwell insert, human pericytes on the reverse insert and human astrocytes in the lower chamber (left panel). After 7 days, the conditioned medium derived from 5-day culture of GBM cells of patient #2, either from differentiated/adherent cells (AC) or stem cell/neurospheres (NS), was added in the lower chamber for 72 h (right panel). Then the medium in the upper and lower chambers was replaced and the cultures were used for the experimental assays. A Transwell containing BBB cells only, grown for 7 days, was used as control (CTRL). b . TEER values of BBB culture. Data are presented as mean ± SD ( n = 3 independent experiments; each experimental point was performed in technical duplicates). *** p < 0.0001: AC/NS vs. CTRL; °°° p < 0.001: AC vs. NS. c . Permeability assays. 5 µM doxorubicin, 10 µM mitoxantrone or 2 µM dextran 70-fluorescein isothiocyanate were added for 3 h. The compounds recovered from the lower chamber were measured fluorometrically. Data are presented as means ± SD ( n = 3 independent experiments; each experimental point was performed in technical duplicates). * p < 0.05, ** p < 0.01, *** p < 0.001: AC/NS vs. CTRL; ° p < 0.05, °°° p < 0.001: AC vs. NS
    Human Pericytes, supplied by PromoCell, used in various techniques. Bioz Stars score: 95/100, based on 1 PubMed citations. ZERO BIAS - scores, article reviews, protocol conditions and more
    https://www.bioz.com/result/human pericytes/product/PromoCell
    Average 95 stars, based on 1 article reviews
    human pericytes - by Bioz Stars, 2026-03
    95/100 stars
      Buy from Supplier

    Image Search Results


    STAT3 expression is reduced in HFpEF pericytes. (A, B) Immunofluorescence staining of control (Ctrl) and HFpEF patient biopsy. (A) Measurement of capillary perimeter. (B) Quantification of pericyte coverage normalised to the vasculature. N = 4 for control and N = 7 for HFpEF. Every data point represents one independent patient. Data are shown as mean ± SEM. P values were calculated using unpaired, two‐tailed Student's t ‐test. (C) Immunofluorescence staining of control and HFpEF mice. Quantification of pericyte coverage normalised to the vasculature. Pericytes were labelled with NG2. N = 4 for control and N = 4 for HFpEF. Every data point represents one independent mouse. Data are shown as mean ± SEM. P value was calculated using unpaired, two‐tailed Student's t ‐test. (D) Uniform Manifold Approximation and Projection (UMAP) plot showing cell‐type specific clustering of all data points from cardiac single‐nuclei sequencing. we identified 13 individual cell types: Cardiomyocytes (CM), Artery (ArtEC), Vein (VeinEC), Capillary (CapEC) and Lymphatic (LymphEC) Endothelial Cells, B Cells, Macrophages (MP), Adipocytes (Adip), Fibroblasts (FB), Pericytes (PC), Smooth Muscle Cells (SMC), Meothelial cells (Meso), Neuronal cells (NC). (E) Gene Ontology (GO) enrichment analysis of significant differentially expressed genes in HFpEF pericytes. Represented are the top 10 downregulated cellular compartments and biological processes. (F) Scatter plot showing Stat3 normalised gene expression values (unique molecular identifier, UMI) for the pericyte cluster in control and HFpEF pericytes. N = 9 for control and N = 3 for HFpEF. Every data point represents one independent mouse. Data are shown as mean ± SEM. P value was calculated using bimod test. (G) Scatter plot showing Stat3 normalised gene expression values (fragments per kilobase of transcript per million mapped reads, FPKM) in control and HFpEF hearts. N = 24 for control and N = 41 for HFpEF. Every data point represents one independent patient. Data are shown as mean ± SEM. P value was calculated using Mann–Whitney test. (H) Immunofluorescence staining of control and HFpEF mice. STAT3 protein expression is reduced in HFpEF mice. N = 4 for control and N = 4 for HFpEF. Every data point represents one independent mouse. Data are shown as mean ± SEM. P value was calculated using unpaired, two‐tailed Student's t ‐test.

    Journal: Febs Letters

    Article Title: STAT3 expression is reduced in cardiac pericytes in HFpEF and its loss reduces cellular adhesion and induces pericyte senescence

    doi: 10.1002/1873-3468.70057

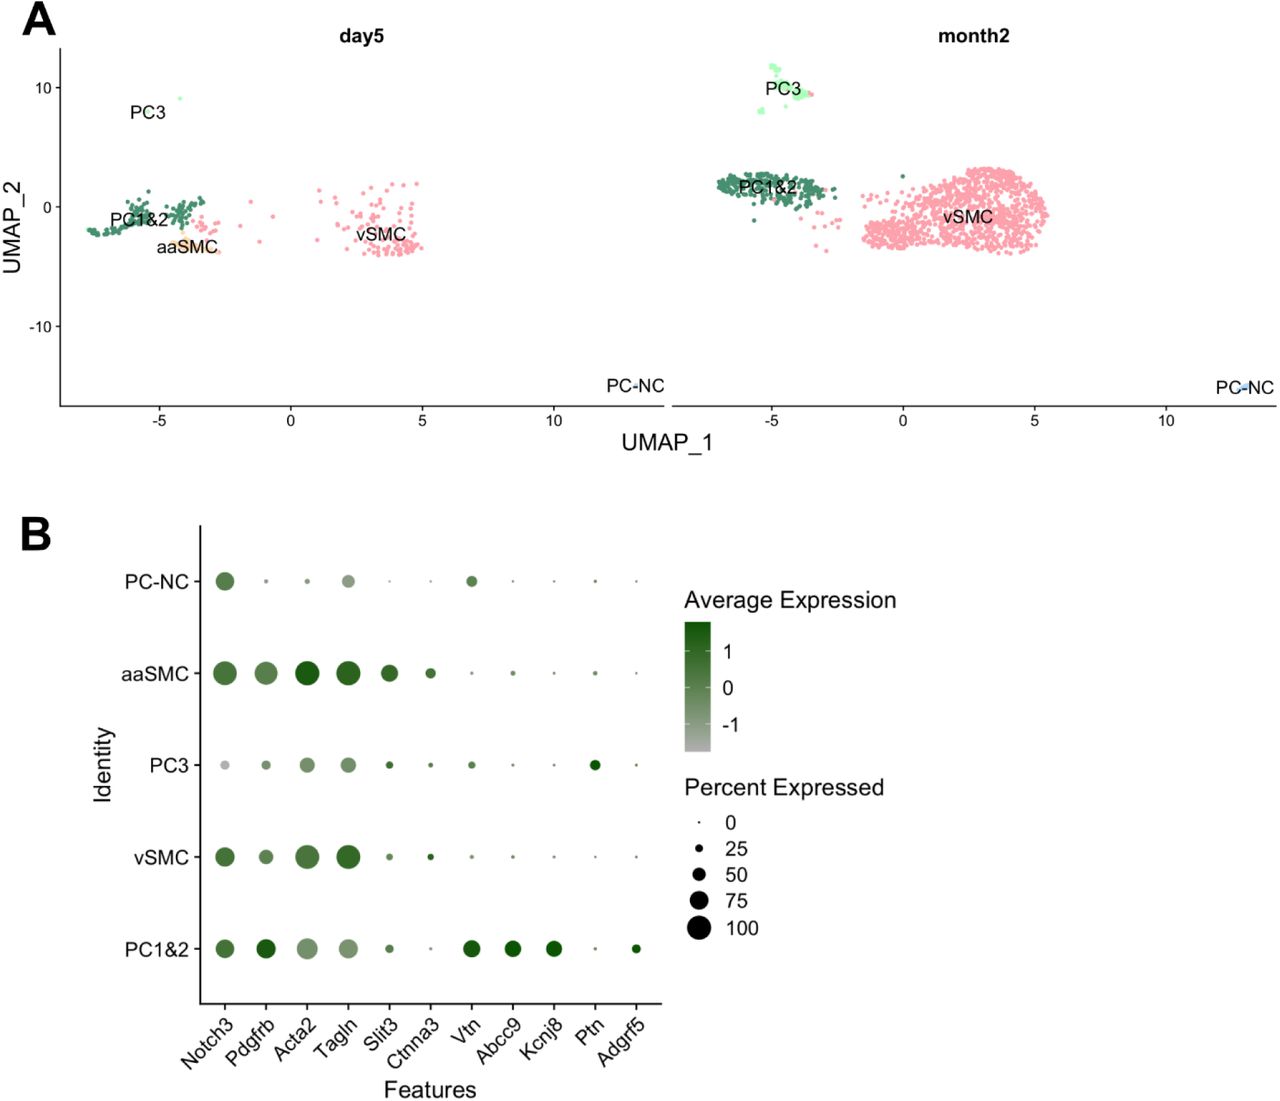
    Figure Lengend Snippet: STAT3 expression is reduced in HFpEF pericytes. (A, B) Immunofluorescence staining of control (Ctrl) and HFpEF patient biopsy. (A) Measurement of capillary perimeter. (B) Quantification of pericyte coverage normalised to the vasculature. N = 4 for control and N = 7 for HFpEF. Every data point represents one independent patient. Data are shown as mean ± SEM. P values were calculated using unpaired, two‐tailed Student's t ‐test. (C) Immunofluorescence staining of control and HFpEF mice. Quantification of pericyte coverage normalised to the vasculature. Pericytes were labelled with NG2. N = 4 for control and N = 4 for HFpEF. Every data point represents one independent mouse. Data are shown as mean ± SEM. P value was calculated using unpaired, two‐tailed Student's t ‐test. (D) Uniform Manifold Approximation and Projection (UMAP) plot showing cell‐type specific clustering of all data points from cardiac single‐nuclei sequencing. we identified 13 individual cell types: Cardiomyocytes (CM), Artery (ArtEC), Vein (VeinEC), Capillary (CapEC) and Lymphatic (LymphEC) Endothelial Cells, B Cells, Macrophages (MP), Adipocytes (Adip), Fibroblasts (FB), Pericytes (PC), Smooth Muscle Cells (SMC), Meothelial cells (Meso), Neuronal cells (NC). (E) Gene Ontology (GO) enrichment analysis of significant differentially expressed genes in HFpEF pericytes. Represented are the top 10 downregulated cellular compartments and biological processes. (F) Scatter plot showing Stat3 normalised gene expression values (unique molecular identifier, UMI) for the pericyte cluster in control and HFpEF pericytes. N = 9 for control and N = 3 for HFpEF. Every data point represents one independent mouse. Data are shown as mean ± SEM. P value was calculated using bimod test. (G) Scatter plot showing Stat3 normalised gene expression values (fragments per kilobase of transcript per million mapped reads, FPKM) in control and HFpEF hearts. N = 24 for control and N = 41 for HFpEF. Every data point represents one independent patient. Data are shown as mean ± SEM. P value was calculated using Mann–Whitney test. (H) Immunofluorescence staining of control and HFpEF mice. STAT3 protein expression is reduced in HFpEF mice. N = 4 for control and N = 4 for HFpEF. Every data point represents one independent mouse. Data are shown as mean ± SEM. P value was calculated using unpaired, two‐tailed Student's t ‐test.

    Article Snippet: Human placenta pericytes (hPL‐PC, C‐12980, PromoCell, Heidelberg, Germany) were cultured in Pericyte Growth Medium 2 (C‐28041, PromoCell) at 37 °C and 5% CO 2 .

    Techniques: Expressing, Immunofluorescence, Staining, Control, Two Tailed Test, Sequencing, Gene Expression, MANN-WHITNEY

    STAT3 deficiency compromises pericytes adhesion. (A) Scheme of the experimental design and RT‐qPCR gene expression analysis of STAT3 showing efficient STAT3 silencing in pericytes. Every data point ( n = 6) represents an independent transfection. Data are shown as mean ± SEM. P values were calculated using unpaired, two‐tailed Student's t ‐test. (B) RT‐qPCR gene expression analysis of PDGFRB and CSPG4 . Every data point ( n = 6) represents an independent transfection. Data are shown as mean ± SEM. P values were calculated using unpaired, two‐tailed Student's t ‐test. (C) Immunofluorescence staining of control and STAT3‐deficient pericytes. Every data point ( n = 6) represents an independent transfection. Data are shown as mean ± SEM. P values were calculated using unpaired, two‐tailed Student's t ‐test. (D) RT‐qPCR gene expression analysis of COL1A1 and COL3A1 . Every data point ( n = 6) represents an independent transfection. Data are shown as mean ± SEM. P values were calculated using unpaired, two‐tailed Student's t ‐test. (E) Immunofluorescence staining of control and STAT3‐deficient pericytes. Violin plots representing every analysed cell in a total of N = 6 independent transfections. P values were calculated using unpaired, Mann–Whitney test. (F) RT‐qPCR gene expression analysis of DES . Every data point ( n = 6) represents an independent transfection. Data are shown as mean ± SEM. P values were calculated using unpaired, two‐tailed Student's t ‐test. (G) Adhesion capacity of control and STAT3‐deficient pericytes. Every data point ( n = 9) represents an independent transfection. Data are shown as mean ± SEM. P values were calculated using unpaired, two‐tailed Student's t ‐test.

    Journal: Febs Letters

    Article Title: STAT3 expression is reduced in cardiac pericytes in HFpEF and its loss reduces cellular adhesion and induces pericyte senescence

    doi: 10.1002/1873-3468.70057

    Figure Lengend Snippet: STAT3 deficiency compromises pericytes adhesion. (A) Scheme of the experimental design and RT‐qPCR gene expression analysis of STAT3 showing efficient STAT3 silencing in pericytes. Every data point ( n = 6) represents an independent transfection. Data are shown as mean ± SEM. P values were calculated using unpaired, two‐tailed Student's t ‐test. (B) RT‐qPCR gene expression analysis of PDGFRB and CSPG4 . Every data point ( n = 6) represents an independent transfection. Data are shown as mean ± SEM. P values were calculated using unpaired, two‐tailed Student's t ‐test. (C) Immunofluorescence staining of control and STAT3‐deficient pericytes. Every data point ( n = 6) represents an independent transfection. Data are shown as mean ± SEM. P values were calculated using unpaired, two‐tailed Student's t ‐test. (D) RT‐qPCR gene expression analysis of COL1A1 and COL3A1 . Every data point ( n = 6) represents an independent transfection. Data are shown as mean ± SEM. P values were calculated using unpaired, two‐tailed Student's t ‐test. (E) Immunofluorescence staining of control and STAT3‐deficient pericytes. Violin plots representing every analysed cell in a total of N = 6 independent transfections. P values were calculated using unpaired, Mann–Whitney test. (F) RT‐qPCR gene expression analysis of DES . Every data point ( n = 6) represents an independent transfection. Data are shown as mean ± SEM. P values were calculated using unpaired, two‐tailed Student's t ‐test. (G) Adhesion capacity of control and STAT3‐deficient pericytes. Every data point ( n = 9) represents an independent transfection. Data are shown as mean ± SEM. P values were calculated using unpaired, two‐tailed Student's t ‐test.

    Article Snippet: Human placenta pericytes (hPL‐PC, C‐12980, PromoCell, Heidelberg, Germany) were cultured in Pericyte Growth Medium 2 (C‐28041, PromoCell) at 37 °C and 5% CO 2 .

    Techniques: Quantitative RT-PCR, Gene Expression, Transfection, Two Tailed Test, Immunofluorescence, Staining, Control, MANN-WHITNEY

    STAT3 deficiency induces cellular senescence in pericytes. (A) Representative FACS plots showing the gating strategy for BrdU proliferation assay. Cell cycle phases distribution differences in control and STAT3‐deficient pericytes. (B) RT‐qPCR gene expression analysis of CDKN1A and TP53 . (C) Measurement of dehydrogenase activity in pericytes using CCK‐8. (D) RT‐qPCR analysis of relative telomere length in control and STAT3‐deficient pericytes. (E) β‐Galactosidase staining of control and STAT3‐deprived pericytes and quantification of β‐galactosidase+ area (%). (A–E) Every data point ( n = 6) represents an independent transfection. Data are shown as mean ± SEM. P values were calculated using unpaired, two‐tailed Student's t ‐test.

    Journal: Febs Letters

    Article Title: STAT3 expression is reduced in cardiac pericytes in HFpEF and its loss reduces cellular adhesion and induces pericyte senescence

    doi: 10.1002/1873-3468.70057

    Figure Lengend Snippet: STAT3 deficiency induces cellular senescence in pericytes. (A) Representative FACS plots showing the gating strategy for BrdU proliferation assay. Cell cycle phases distribution differences in control and STAT3‐deficient pericytes. (B) RT‐qPCR gene expression analysis of CDKN1A and TP53 . (C) Measurement of dehydrogenase activity in pericytes using CCK‐8. (D) RT‐qPCR analysis of relative telomere length in control and STAT3‐deficient pericytes. (E) β‐Galactosidase staining of control and STAT3‐deprived pericytes and quantification of β‐galactosidase+ area (%). (A–E) Every data point ( n = 6) represents an independent transfection. Data are shown as mean ± SEM. P values were calculated using unpaired, two‐tailed Student's t ‐test.

    Article Snippet: Human placenta pericytes (hPL‐PC, C‐12980, PromoCell, Heidelberg, Germany) were cultured in Pericyte Growth Medium 2 (C‐28041, PromoCell) at 37 °C and 5% CO 2 .

    Techniques: Proliferation Assay, Control, Quantitative RT-PCR, Gene Expression, Activity Assay, CCK-8 Assay, Staining, Transfection, Two Tailed Test

    STAT3 knockdown induces a transcriptional signature similar to HFpEF. (A) Gene Ontology (GO) enrichment analysis of significant differentially expressed genes in STAT3‐deficient pericytes. Represented are the top 6 dysregulated pathways. (B) Scatter plot showing CDKN1A , CDKN1B and CDKN2B normalised gene expression values (fragments per kilobase of transcript per million mapped reads, FPKM) in control and STAT3‐deficient pericytes hearts. Every data point ( n = 3) represents an independent transfection. Data are shown as mean ± SEM. P values were calculated using cuffdiff test. (C) Gene Ontology (GO) enrichment analysis of significant differentially expressed genes in STAT3‐deficient pericytes. Represented are the top six dysregulated cellular components. (D) Scatter plot showing ARPC5L , RAB21 and GJA1 normalised gene expression values (fragments per kilobase of transcript per million mapped reads, FPKM) in control and STAT3‐deficient pericytes hearts. Every data point ( n = 3) represents an independent transfection. Data are shown as mean ± SEM. P values were calculated using the Wald test for significance of the negative binomial model coefficients, as implemented in DESeq2. (E) Cumulative distribution of the expression change of genes grouped by their total number of STAT3 binding sites in their enhancers. The numbers in parentheses indicate the number of genes in each set. (F) Scatter plot showing COL5A2, COL5A3 and COL27A1 normalised gene expression values (fragments per kilobase of transcript per million mapped reads, FPKM) in control and STAT3‐deficient pericytes hearts. Every data point ( n = 3) represents an independent transfection. Data are shown as mean ± SEM. P values were calculated using the Wald test for significance of the negative binomial model coefficients, as implemented in DESeq2. (G) RT‐qPCR gene expression analysis of STAT3, ACTA2, COL1A1 and COL3A1 in pericytes upon IL‐1β treatment. Every data point ( n = 6) represents an independent transfection. Data are shown as mean ± SEM. P values were calculated using unpaired, two‐tailed Student's t ‐test.

    Journal: Febs Letters

    Article Title: STAT3 expression is reduced in cardiac pericytes in HFpEF and its loss reduces cellular adhesion and induces pericyte senescence

    doi: 10.1002/1873-3468.70057

    Figure Lengend Snippet: STAT3 knockdown induces a transcriptional signature similar to HFpEF. (A) Gene Ontology (GO) enrichment analysis of significant differentially expressed genes in STAT3‐deficient pericytes. Represented are the top 6 dysregulated pathways. (B) Scatter plot showing CDKN1A , CDKN1B and CDKN2B normalised gene expression values (fragments per kilobase of transcript per million mapped reads, FPKM) in control and STAT3‐deficient pericytes hearts. Every data point ( n = 3) represents an independent transfection. Data are shown as mean ± SEM. P values were calculated using cuffdiff test. (C) Gene Ontology (GO) enrichment analysis of significant differentially expressed genes in STAT3‐deficient pericytes. Represented are the top six dysregulated cellular components. (D) Scatter plot showing ARPC5L , RAB21 and GJA1 normalised gene expression values (fragments per kilobase of transcript per million mapped reads, FPKM) in control and STAT3‐deficient pericytes hearts. Every data point ( n = 3) represents an independent transfection. Data are shown as mean ± SEM. P values were calculated using the Wald test for significance of the negative binomial model coefficients, as implemented in DESeq2. (E) Cumulative distribution of the expression change of genes grouped by their total number of STAT3 binding sites in their enhancers. The numbers in parentheses indicate the number of genes in each set. (F) Scatter plot showing COL5A2, COL5A3 and COL27A1 normalised gene expression values (fragments per kilobase of transcript per million mapped reads, FPKM) in control and STAT3‐deficient pericytes hearts. Every data point ( n = 3) represents an independent transfection. Data are shown as mean ± SEM. P values were calculated using the Wald test for significance of the negative binomial model coefficients, as implemented in DESeq2. (G) RT‐qPCR gene expression analysis of STAT3, ACTA2, COL1A1 and COL3A1 in pericytes upon IL‐1β treatment. Every data point ( n = 6) represents an independent transfection. Data are shown as mean ± SEM. P values were calculated using unpaired, two‐tailed Student's t ‐test.

    Article Snippet: Human placenta pericytes (hPL‐PC, C‐12980, PromoCell, Heidelberg, Germany) were cultured in Pericyte Growth Medium 2 (C‐28041, PromoCell) at 37 °C and 5% CO 2 .

    Techniques: Knockdown, Gene Expression, Control, Transfection, Expressing, Binding Assay, Quantitative RT-PCR, Two Tailed Test

    Mouse mural cells sub-cluster into five groups, resembling cell types previously described in the brain, with one (aaSMC) detected only day 5 after PSNL or sham surgery (A). Acta2 & Tagln high vascular smooth muscle cells (vSMC), arteriolar SMCs enriched for Slit3 and Ctnna3 (aaSMC), Vtn & Abcc9 & Kcnj8 positive pericytes (PC1&2), Adgrf5 negative (PC3) and Acta2 negative pericytes (PC-NC). Expression of marker genes is plotted in B. No prominent differences were detected between sham and PSNL groups at either timepoints.

    Journal: bioRxiv

    Article Title: A role for fibroblast and mural cell subsets in models of neuropathic pain

    doi: 10.1101/2024.12.11.627455

    Figure Lengend Snippet: Mouse mural cells sub-cluster into five groups, resembling cell types previously described in the brain, with one (aaSMC) detected only day 5 after PSNL or sham surgery (A). Acta2 & Tagln high vascular smooth muscle cells (vSMC), arteriolar SMCs enriched for Slit3 and Ctnna3 (aaSMC), Vtn & Abcc9 & Kcnj8 positive pericytes (PC1&2), Adgrf5 negative (PC3) and Acta2 negative pericytes (PC-NC). Expression of marker genes is plotted in B. No prominent differences were detected between sham and PSNL groups at either timepoints.

    Article Snippet: A vial of human placental pericytes was purchased by PromoCell (#C-12980) and a human peripheral nerve pericyte line was obtained under MTA from Profs.

    Techniques: Expressing, Marker

    Plotted here is a selection of mediators, the majority of which we identified as differentially expressed in pericytes in our bulk sequencing experiment (Il6, Lif, Clcf1, Ccl2 and Tnc). Their expression patterns appeared to differ across mural cell populations, with significant enrichment of Il6, Ccl2 and Tnc in PC1&2 pericytes, and Clcf1 in Acta2 negative pericytes (PC-NC).

    Journal: bioRxiv

    Article Title: A role for fibroblast and mural cell subsets in models of neuropathic pain

    doi: 10.1101/2024.12.11.627455

    Figure Lengend Snippet: Plotted here is a selection of mediators, the majority of which we identified as differentially expressed in pericytes in our bulk sequencing experiment (Il6, Lif, Clcf1, Ccl2 and Tnc). Their expression patterns appeared to differ across mural cell populations, with significant enrichment of Il6, Ccl2 and Tnc in PC1&2 pericytes, and Clcf1 in Acta2 negative pericytes (PC-NC).

    Article Snippet: A vial of human placental pericytes was purchased by PromoCell (#C-12980) and a human peripheral nerve pericyte line was obtained under MTA from Profs.

    Techniques: Selection, Sequencing, Expressing

    Each dot is a well of cells. Filled circles shows the expression levels obtained from media taken from a placental pericyte line, open circles those obtained from a nerve pericyte line. Ctrl = regular pericyte media; other columns: pericytes treated for four hours with TNF (10ng/ml), IL-17 (10ng/ml), TNF+IL-17 (both at 10ng/ml), IL-4 (10ng/ml) or IFNγ (100ng/ml). The red dotted lines represent the upper and lower limits of the standard curves for each protein, i.e. the upper and lower detection limits. Shown here are 1:100 dilutions for IL-6 and NGF and 1:2 dilutions for CCL2.

    Journal: bioRxiv

    Article Title: A role for fibroblast and mural cell subsets in models of neuropathic pain

    doi: 10.1101/2024.12.11.627455

    Figure Lengend Snippet: Each dot is a well of cells. Filled circles shows the expression levels obtained from media taken from a placental pericyte line, open circles those obtained from a nerve pericyte line. Ctrl = regular pericyte media; other columns: pericytes treated for four hours with TNF (10ng/ml), IL-17 (10ng/ml), TNF+IL-17 (both at 10ng/ml), IL-4 (10ng/ml) or IFNγ (100ng/ml). The red dotted lines represent the upper and lower limits of the standard curves for each protein, i.e. the upper and lower detection limits. Shown here are 1:100 dilutions for IL-6 and NGF and 1:2 dilutions for CCL2.

    Article Snippet: A vial of human placental pericytes was purchased by PromoCell (#C-12980) and a human peripheral nerve pericyte line was obtained under MTA from Profs.

    Techniques: Expressing

    (A) Representative Western blot of neuronal pSTAT3 and STAT3 following conditioned media incubation. See Supplementary Materials for all full-length Western Blots. (B) Quantification of neuronal pSTAT3/STAT3 following incubation with cytokine-activated pericyte conditioned media (CM). Each dot represents an independent neuron differentiation (T36-43, n=5). N2 = neuronal control medium.

    Journal: bioRxiv

    Article Title: A role for fibroblast and mural cell subsets in models of neuropathic pain

    doi: 10.1101/2024.12.11.627455

    Figure Lengend Snippet: (A) Representative Western blot of neuronal pSTAT3 and STAT3 following conditioned media incubation. See Supplementary Materials for all full-length Western Blots. (B) Quantification of neuronal pSTAT3/STAT3 following incubation with cytokine-activated pericyte conditioned media (CM). Each dot represents an independent neuron differentiation (T36-43, n=5). N2 = neuronal control medium.

    Article Snippet: A vial of human placental pericytes was purchased by PromoCell (#C-12980) and a human peripheral nerve pericyte line was obtained under MTA from Profs.

    Techniques: Western Blot, Incubation, Control

    Effects of glioblastoma multiforme medium on BBB model made by endothelial cells, astrocytes and pericytes. a . A triculture-based model of the blood-brain barrier (BBB) was performed by seeding human hCMEC/D3 cells in the Transwell insert, human pericytes on the reverse insert and human astrocytes in the lower chamber (left panel). After 7 days, the conditioned medium derived from 5-day culture of GBM cells of patient #2, either from differentiated/adherent cells (AC) or stem cell/neurospheres (NS), was added in the lower chamber for 72 h (right panel). Then the medium in the upper and lower chambers was replaced and the cultures were used for the experimental assays. A Transwell containing BBB cells only, grown for 7 days, was used as control (CTRL). b . TEER values of BBB culture. Data are presented as mean ± SD ( n = 3 independent experiments; each experimental point was performed in technical duplicates). *** p < 0.0001: AC/NS vs. CTRL; °°° p < 0.001: AC vs. NS. c . Permeability assays. 5 µM doxorubicin, 10 µM mitoxantrone or 2 µM dextran 70-fluorescein isothiocyanate were added for 3 h. The compounds recovered from the lower chamber were measured fluorometrically. Data are presented as means ± SD ( n = 3 independent experiments; each experimental point was performed in technical duplicates). * p < 0.05, ** p < 0.01, *** p < 0.001: AC/NS vs. CTRL; ° p < 0.05, °°° p < 0.001: AC vs. NS

    Journal: Fluids and Barriers of the CNS

    Article Title: Blood-brain barrier permeability increases with the differentiation of glioblastoma cells in vitro

    doi: 10.1186/s12987-024-00590-0

    Figure Lengend Snippet: Effects of glioblastoma multiforme medium on BBB model made by endothelial cells, astrocytes and pericytes. a . A triculture-based model of the blood-brain barrier (BBB) was performed by seeding human hCMEC/D3 cells in the Transwell insert, human pericytes on the reverse insert and human astrocytes in the lower chamber (left panel). After 7 days, the conditioned medium derived from 5-day culture of GBM cells of patient #2, either from differentiated/adherent cells (AC) or stem cell/neurospheres (NS), was added in the lower chamber for 72 h (right panel). Then the medium in the upper and lower chambers was replaced and the cultures were used for the experimental assays. A Transwell containing BBB cells only, grown for 7 days, was used as control (CTRL). b . TEER values of BBB culture. Data are presented as mean ± SD ( n = 3 independent experiments; each experimental point was performed in technical duplicates). *** p < 0.0001: AC/NS vs. CTRL; °°° p < 0.001: AC vs. NS. c . Permeability assays. 5 µM doxorubicin, 10 µM mitoxantrone or 2 µM dextran 70-fluorescein isothiocyanate were added for 3 h. The compounds recovered from the lower chamber were measured fluorometrically. Data are presented as means ± SD ( n = 3 independent experiments; each experimental point was performed in technical duplicates). * p < 0.05, ** p < 0.01, *** p < 0.001: AC/NS vs. CTRL; ° p < 0.05, °°° p < 0.001: AC vs. NS

    Article Snippet: Human pericytes (hPEs; #C-12980, PromoCell, Heidelberg, Germany) were cultured in Pericyte Growth Medium 2 (#C-28041, PromoCell) as per the manufacturer’s instructions The hCMEC/D3-hAs-hPEs triculture was performed according to [ ].

    Techniques: Derivative Assay, Control, Permeability